
How to implement strain gauge measurement
Strain and Strain Gauge Overview <br> Strain is the amount of force applied to an object causing it to deform. More precisely, strain can be defined as a small change in length, as shown in Figure 1.

Figure 1. Definition of strain
Although there are several methods for strain measurement, the most common method is to use a strain gauge, and its resistance will change in proportion to the amount it produces. The most commonly used strain gauge is a gluing metal strain gauge.
Metal strain gauges consist of extremely thin leads, more commonly composed of grid-like metal foils. The form of the grid allows metal leads or lamellae to follow the strain in the parallel direction to the greatest degree (Figure 2). The grid is glued to a thin substrate called a carrier and connected directly to the test piece. Therefore, the strain produced by the tested part is directly reflected on the strain gauge, which makes the strain gauge resistance value produce a linear change. Strain gauges available on the market range from 30 to 3,000 ohms. The most common resistances are: 120, 350, and 1000 ohms.
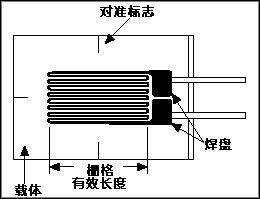
Figure 2. Glued metal strain gauge
Typical sensor pin
In practical applications, strain measurements rarely show more than a few millimeters of strain (ex 10-3). Therefore, strain measurements must be able to accurately measure very small changes in resistance. In order to measure such a small change in resistance, strain gauges are almost always in the form of bridges with voltage excitation. The ordinary Wheatstone bridge, as shown in Fig. 3, consists of four resistor bridge arms and the excitation voltage VEX acting on the entire bridge.

Figure 3. Wheatstone bridge configuration
The output voltage VO of the bridge is as follows:
![]()
From this equation it can be seen that when R1/R2 = R4/R3, the voltage output VO is zero. In this condition, the bridge is said to be in equilibrium. At this time, the change of the resistance value on any bridge arm will make the bridge voltage output non-zero.
Therefore, if you replace R4 in Figure 3 with a strain gauge, the change in the strain gauge resistance value will make the bridge unbalanced and the voltage output will be non-zero. If the ideal resistance value of the strain gage is RG, then the strain change produced by DR can be expressed as DR = RG*GF*e. Let R1 = R2 and R3 = RG. The above bridge equation can be rewritten as a function of VO/VEX corresponding transformation (see Figure 4). Note the 1/(1+GF*e/2) term, which represents the strain-related output nonlinear change of the 1/4 bridge.

Figure 4. Quarter-bridge circuit
Ideally, we want the strain gauge's resistance to change only when there is strain. However, the strain gauge material and the material under test are also sensitive to changes in temperature at the same time. Strain gauge manufacturers attempt to minimize the sensitivity of the strain gauge to temperature by processing the strain gauge material to compensate for the thermal expansion of the part under test. However, compensation can only reduce the sensitivity of the strain gauge to temperature, but it cannot completely eliminate the temperature effect.
By using two strain gauges in the bridge, the effect of temperature can be further reduced. For example, in the strain gauge configuration shown in Figure 5, one strain gauge (RG+DR) is in operation, and the other strain gauge is placed in its lateral direction. Therefore, the strain has almost no effect on the second strain gauge, which is called a compensation rule. However, the change in temperature has the same effect on the two sets of strain gauges. Since the temperature change is the same for both sets of strain gauges, the resistance value ratio and voltage VO do not change, and the effect of temperature is reduced.
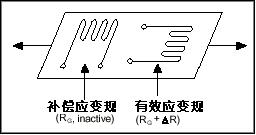
Figure 5. Using compensation gauges to eliminate temperature effects
When there are two working strain gauges in the half bridge, the sensitivity of the bridge can be doubled. For example, Figure 6 shows a flexural beam application where one set of strain gauges induces tension (RG + DR) and the other set of gauge gauges sense pressure (RG - DR). The circuit diagram for this half-bridge configuration is also shown in Figure 6. Its output voltage is linear and the output voltage is about twice that of a 1/4 bridge.
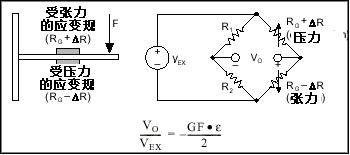
Figure 6. Half-bridge circuit
Finally, the full bridge configuration can also be achieved by installing the working strain gauges on all four bridges of the bridge, thereby increasing the sensitivity of the circuit. The full-bridge circuit is shown in Figure 7.
Figure 7. Full-bridge circuit
Therefore, in the quarter-bridge circuit, only one bridge arm is equipped with a working strain gauge; in the half-bridge circuit, two bridge arms are working strain gauges; all four bridge arms in the full bridge circuit are working strain gauges.
Strain gauges have no polarity, but according to the above three different bridge circuit configurations, the measurement hardware wiring is also different, the following sections will be described in detail.
How to Perform Strain Gauge Measurements Most strain gauge measurement solutions offer 1/4-bridge, half-bridge, and full-bridge configurations.
Consider the NI Compactix system and the NI 9237 4-channel sync bridge C Series module. Figure 8 shows the wiring diagram for connecting the strain gauge on the 1/4 bridge to this module.
Connect one end of the quarter bridge strain gauge to the CH+ terminal on the module and the other end to the module QTR terminal. Note that the EX-port is not wired on the module because in the 1/4-bridge configuration, R3 is internal to the measurement hardware (see Figure 8).

Figure 8. 1/4-bridge configuration wiring diagram
In the half-bridge configuration measurement, connect the working element to the EX+ and EX- terminals of the module. Finally, connect the common point of the two working elements to the QTR of the measurement module (see Figure 9).
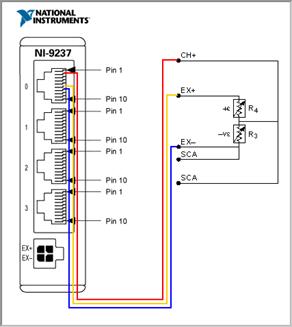
Figure 9. Half-bridge configuration wiring diagram
In the measurement of the full-bridge configuration, the common ends of R1 and R4 are connected to EX+, and the common ends of R2 and R3 are connected to EX-. At the same time, the common ends of R3 and R4 are connected to CH+, and the common ends of R1 and R2 are connected to CH-.
Figure 10. Full-bridge configuration wiring diagram
Measurement Visualization: NI LabVIEW
After connecting the sensor to the measurement device, you can use LabVIEW graphical programming software to transfer the data to a computer for data visualization.
Excerpt from: NI "General Measurement Guide"
Solar Battery takes an important rule in solar lighting, Could divide into Gelled Type and Lead-acid Type.
Gelled Batteries, or "Gel Cells" contain acid that has been "gelled" by the addition of Silica Gel, turning the acid into a solid mass that looks like gooey Jell-O.
The advantage of these batteries is that it is impossible to spill acid even if they are broken.
Other Advantages of BR Solar Solar Battery:
1.)Real Green Power
2.)Low Internal Resistance
3.)Low Self-discharging Rate
4.)Low Gassing Rate
5.)Long-life Design
6.)Wider Temperature Range
7.)Extremely good discharge recovery ability


Solar Battery Ups Battery,12 Volt Solar Ups Battery,High Capacity Solar Ups Battery,Energy Storage Solar Ups Battery
Yangzhou Bright Solar Solutions Co., Ltd. , https://www.solarlights.pl