
How to achieve frequency measurement
Frequency overview
The frequency is the repetition rate of a cycle or cycle event. Physically speaking, cycles can be observed in phenomena such as rotation, vibration, and wave. For analog or digital waveforms, the frequency can be obtained through the signal period. The smaller the period, the greater the frequency, and vice versa. As you can see from Figure 1, the top waveform has the lowest frequency and the bottom waveform has the highest frequency.
Figure 1. Waveform frequencies increase from top to bottom
The frequency is usually expressed as angular frequency ω in radians per second, or as ? in units of seconds -1, also known as Hz. It can also be expressed in beats per minute (BPM) or revolutions per minute (RPM). frequency. The relation between the angular frequency ω (rad/sec) and ? (Hz) is: ω = 2π?. When it comes to frequency, it often involves phase φ, which describes the offset of the waveform at the initial time t0 relative to the specified reference point. The unit is usually degrees or radians. In the case of a sine wave, the waveform expression takes time as its parameter, its amplitude is A, its angular frequency is ω, and its phase φ is a constant.
The periodic analog signals in practical applications are complex and difficult to describe with a simple sinusoidal curve. Fourier analysis can decompose arbitrary complex waveforms into simple sums of sine, cosine or complex exponential functions. The frequency components contained in the signal are often of interest to us. This analysis method is called frequency domain analysis or spectral analysis. This kind of analysis method is mainly used in sound, vibration and other fields, and will not be discussed here.
On the other hand, the frequency of digital signals is relatively simple to obtain. For a simple digital signal as described in Figure 2, the period is the time between two rising or falling edges.
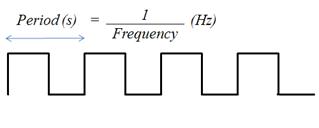
Figure 2. Digital waveform
If there is a deviation in the time between two different rising or falling edges, the frequency can also be obtained by means of averaging after a large number of samples.
How to achieve frequency measurement <br> The digital frequency acquisition process is quite simple. For low frequency signals, it is sufficient to use a counter or time base. The rising edge of the input signal triggers the time base to begin counting. Because the frequency of the time base is known, the frequency of the input signal can be calculated very simply (see Figure 3).

Figure 3. Digital signal vs. internal time base (single counter to get low frequency)
When the frequency of the digital signal is high or variable, the two double counter methods described below are preferably used. It should be noted that the two methods have the same hardware limitations. That is, the frequency to be measured must not exceed the maximum input frequency supported by the counter, but it can exceed the built-in time base frequency.
High frequency double counter measurement method
High-frequency signal measurement requires two counters. A pair of (two) counters generate a user-specified period of pulse trains. The measurement time (see Figure 4) is much larger than the signal to be measured, but it must be as small as possible to avoid counter rollover.

Figure 4. Dual counter method measurement of digital signal frequency (used to measure high frequency signals)
The built-in signal measurement time is an integral multiple of the built-in time base. The number of oscillations of the input signal is measured over a certain time interval, and the interval time is provided by the built-in signal. The frequency of the input signal can be obtained by dividing the number of oscillations by the interval time.
Large range double counter measurement
For frequency-varying signals, this dual-counter method provides higher accuracy over the entire signal range. In this case the input signal is divided by a known amount, or divided. The number of oscillations of the built-in time base at the logic high of the divided signal is noted (see Figure 5). In this way, the time between logic high levels is obtained by multiplying the number of oscillations by the period time of the built-in time base. This value is multiplied by 2 to obtain the period of the divided signal (sum of the high and low time), which is an integral multiple of the input signal period. Counting the input signal period yields its frequency.
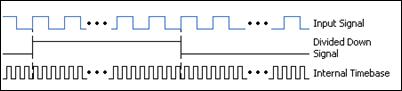
Figure 5. Double Counter Method Measurement of Digital Signal Frequency (for Large Range Measurements)
This method is equivalent to averaging the signal after a wide range of measurements to obtain the frequency of change of the signal, but this method can also measure the input signal higher than the frequency of the time base.
Connection of digital signal and measurement equipment in frequency measurement
Many devices with hardware timers are suitable for counter measurements. Here is an example of an NI CompactDAQ system (see Figure 6). The NI CompactDAQ hardware timing is on the rear panel of the chassis and is not just for NI C Series modules. With the cDAQ-9172 chassis, only 5 and 6 slots can be connected to the PFI as a counter input, so you must insert a digital input or digital input/output (DIO) module, such as the NI 9401, into the 5 or 6 slot of the NI CompactDAQ chassis.

Figure 6. NI 9401-Related DIO C-Series Modules and CompactDAQ Chassis
After the frequency acquisition is configured as a counter task in the Measurement & Automation Control Manager (MAX), the PFI input terminal to which the signal is required to connect is displayed (see Figure 7).

Figure 7. Screen capture of Measurement & Automation Manager (MAX) configuration screen
Measurement Visualization: NI LabVIEW
After completing the system configuration, you can see the measurement data in the LabVIEW graphical programming environment (see Figure 8).
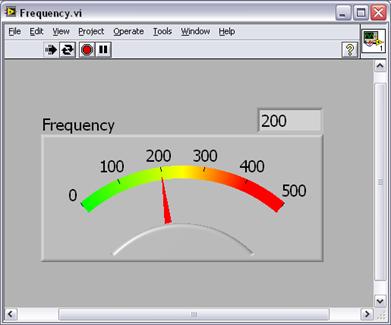
Figure 8. Frequency Measurements Seen in LabVIEW
Excerpt from: NI "General Measurement Guide"
XLPE insulated flame retardant shipboard symmetrical communication cables, XLPE insulated flame retardant shipboard symmetrical communication cables(single sheath), XLPE insulated fire resistant shipboard symmetrical communication cables and XLPE insulated fire resistant shipboard symmetrical communication cables(single sheath) belongs to Shipboard Communication Cables, which manufactured by Jiangyang Special Cable Company Limited.
The shipboard cables with symmetrical conductors are intended for telecommunication, computer and information proceeding unit of shipboard, off-shore building and naval ship, and it also can be available to metallurgical industry, chemical works, power plant and mine, etc.
Different Types Of Cables,Marine Communication Cable,Data Communication Cable Types,Flex Marine Communication Cable
Jiangsu Jiangyang Special Cable Co,.Ltd. , https://www.jymarinecable.com